Menu

EU Legislative Productivity, 2004-2019


The European Union (EU) is the subject of heated debates, often quite polarized between Eurosceptics and supporters of European integration. Most of these debates focus on controversial European politicians and political parties or on general values and principles - cosmopolitanism versus nationalism, for example. There is much less discussion of the actual laws and policies that the EU adopts and implements, of the regulations it drafts and of the rules it makes, although it is the rules and regulations that affect all our daily lives. Even experts on European politics will be hard pressed to provide correct estimates of the legislative productivity of the EU or to name more than a couple of recent pieces of important legislation that the EU has passed. And this goes for proponents and opponents of European integration alike.

Yet, naturally, having a good idea about what the EU does is important for forming opinions whether we like the EU or not and whether we want European integration to proceed further. This presentation focuses on one important aspect of what the EU does: legislative productivity. Measuring the legislative productivity and output of the EU is especially relevant since the EU has no army or large budget to exercise its influence, but it must rely on its laws and regulations. Hence, by looking at legislative productivity we examine the health and prospects of the EU integration project more generally.

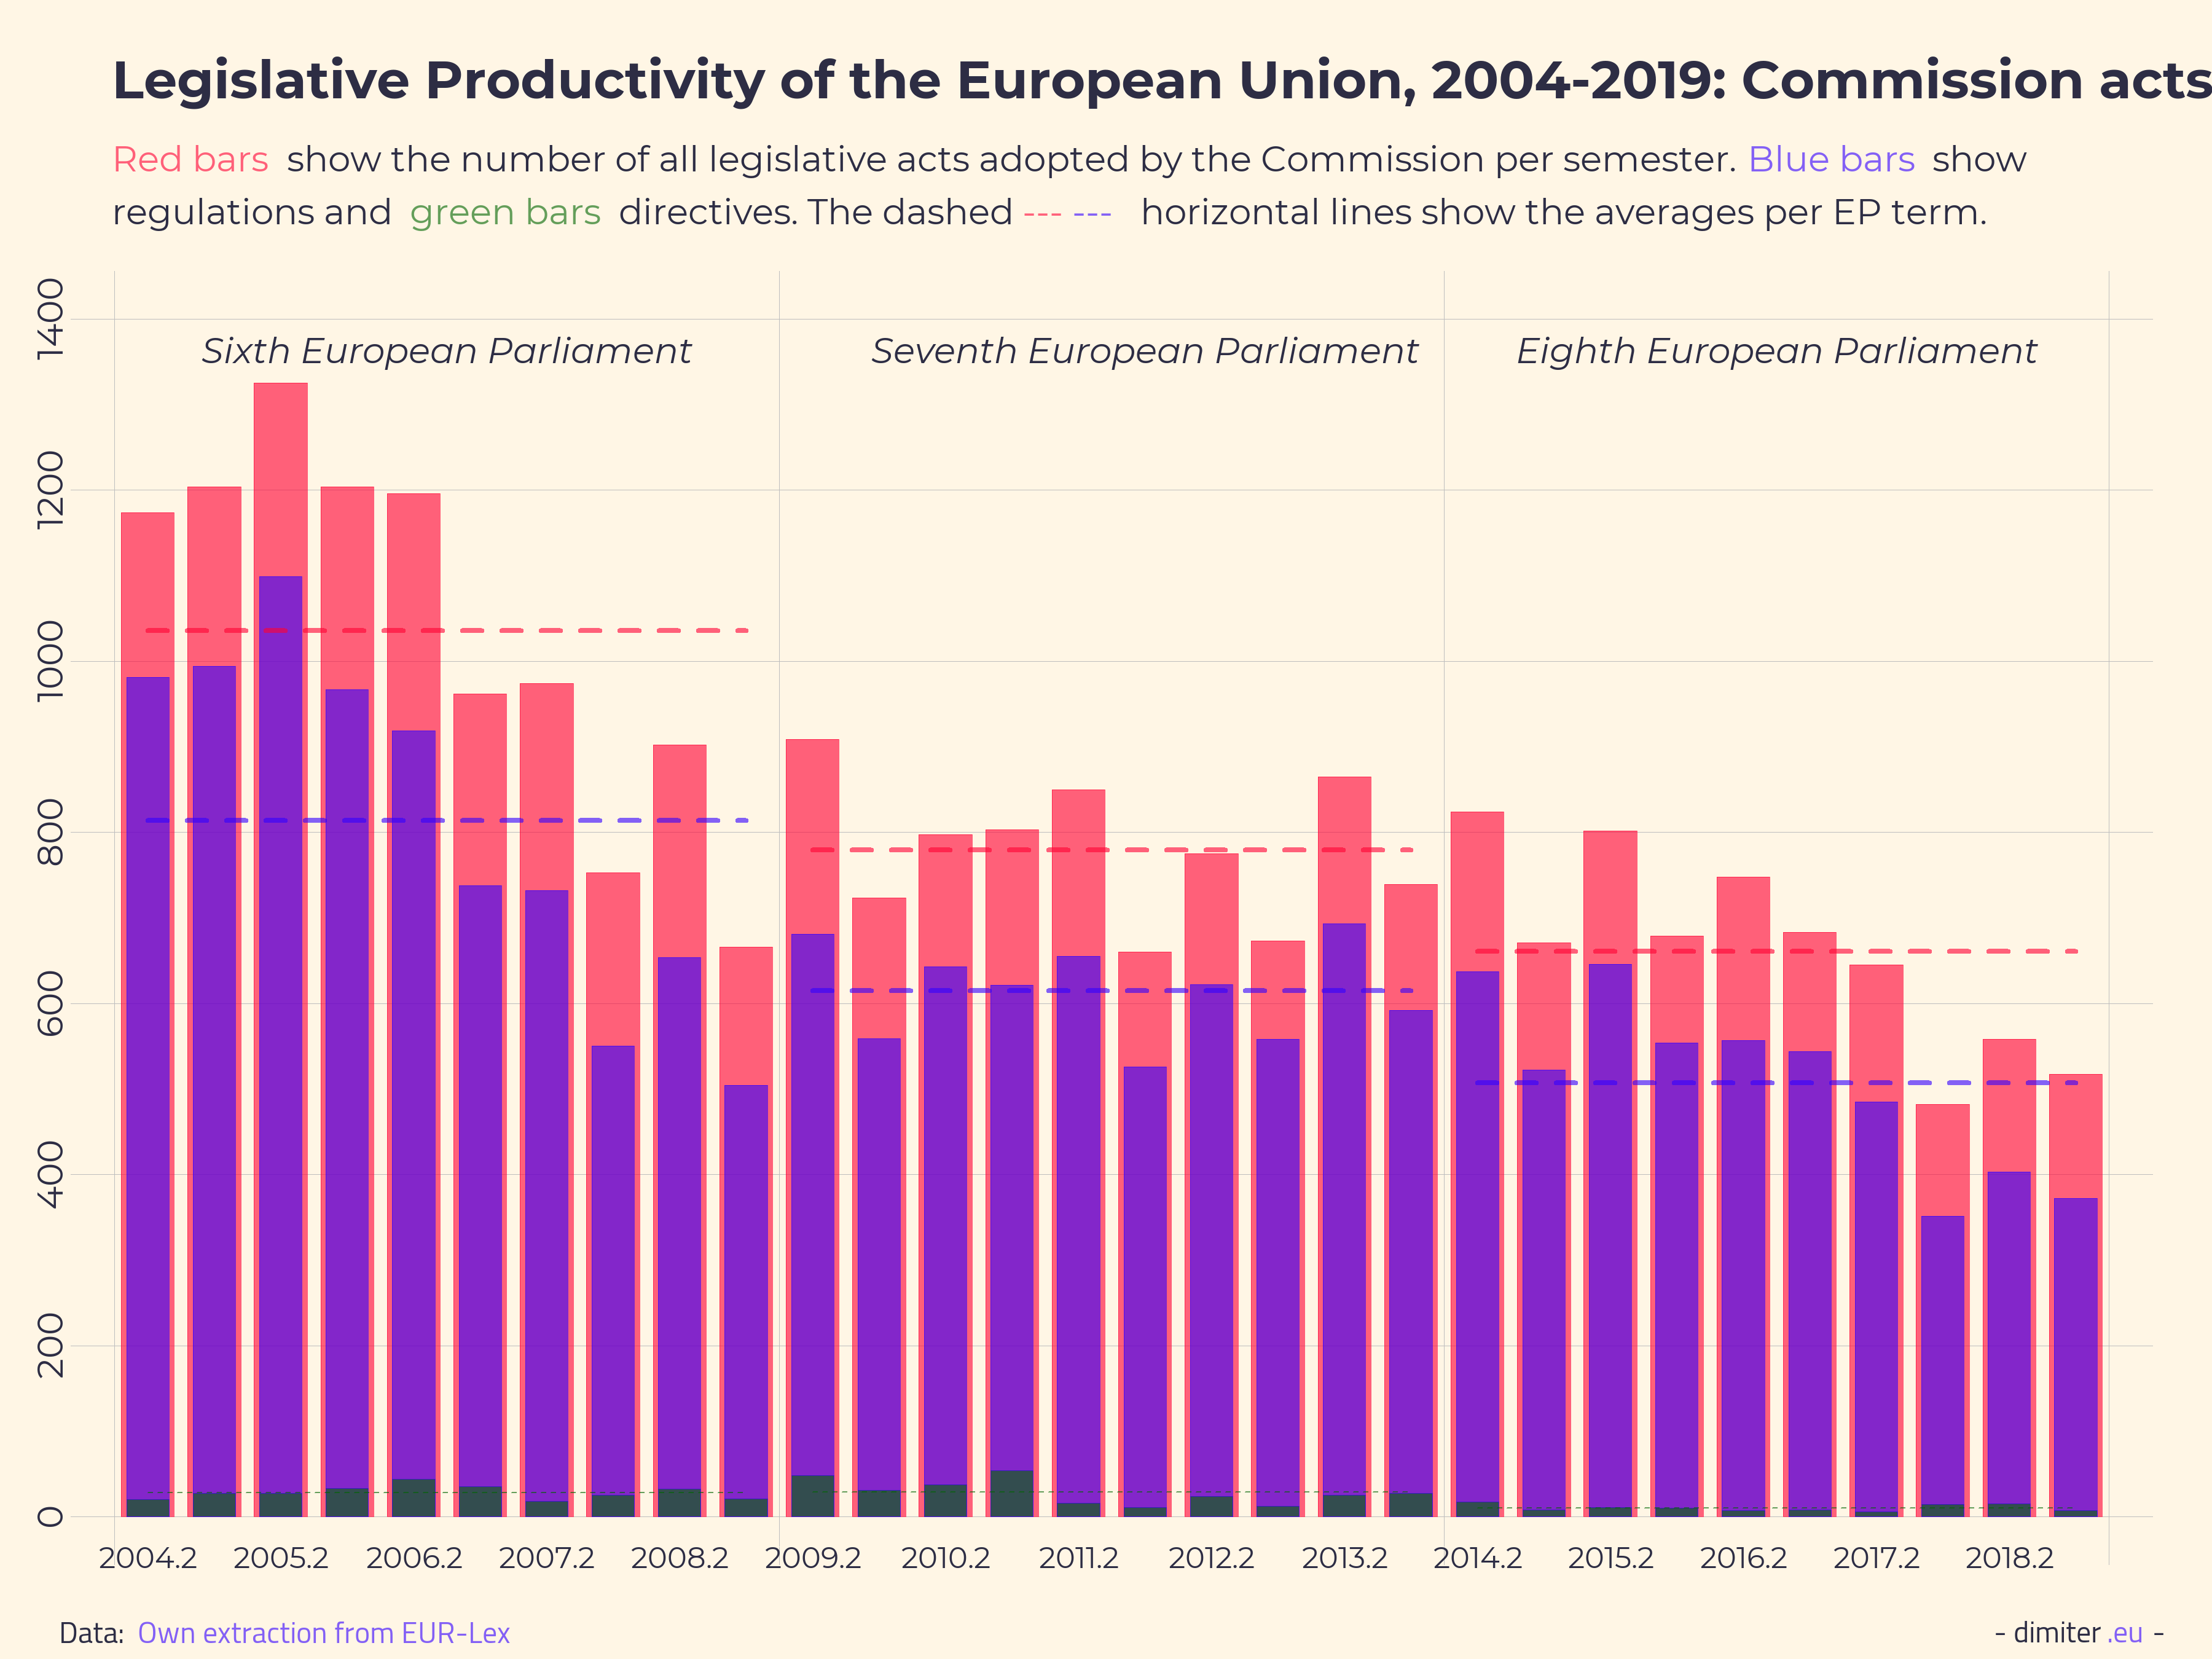
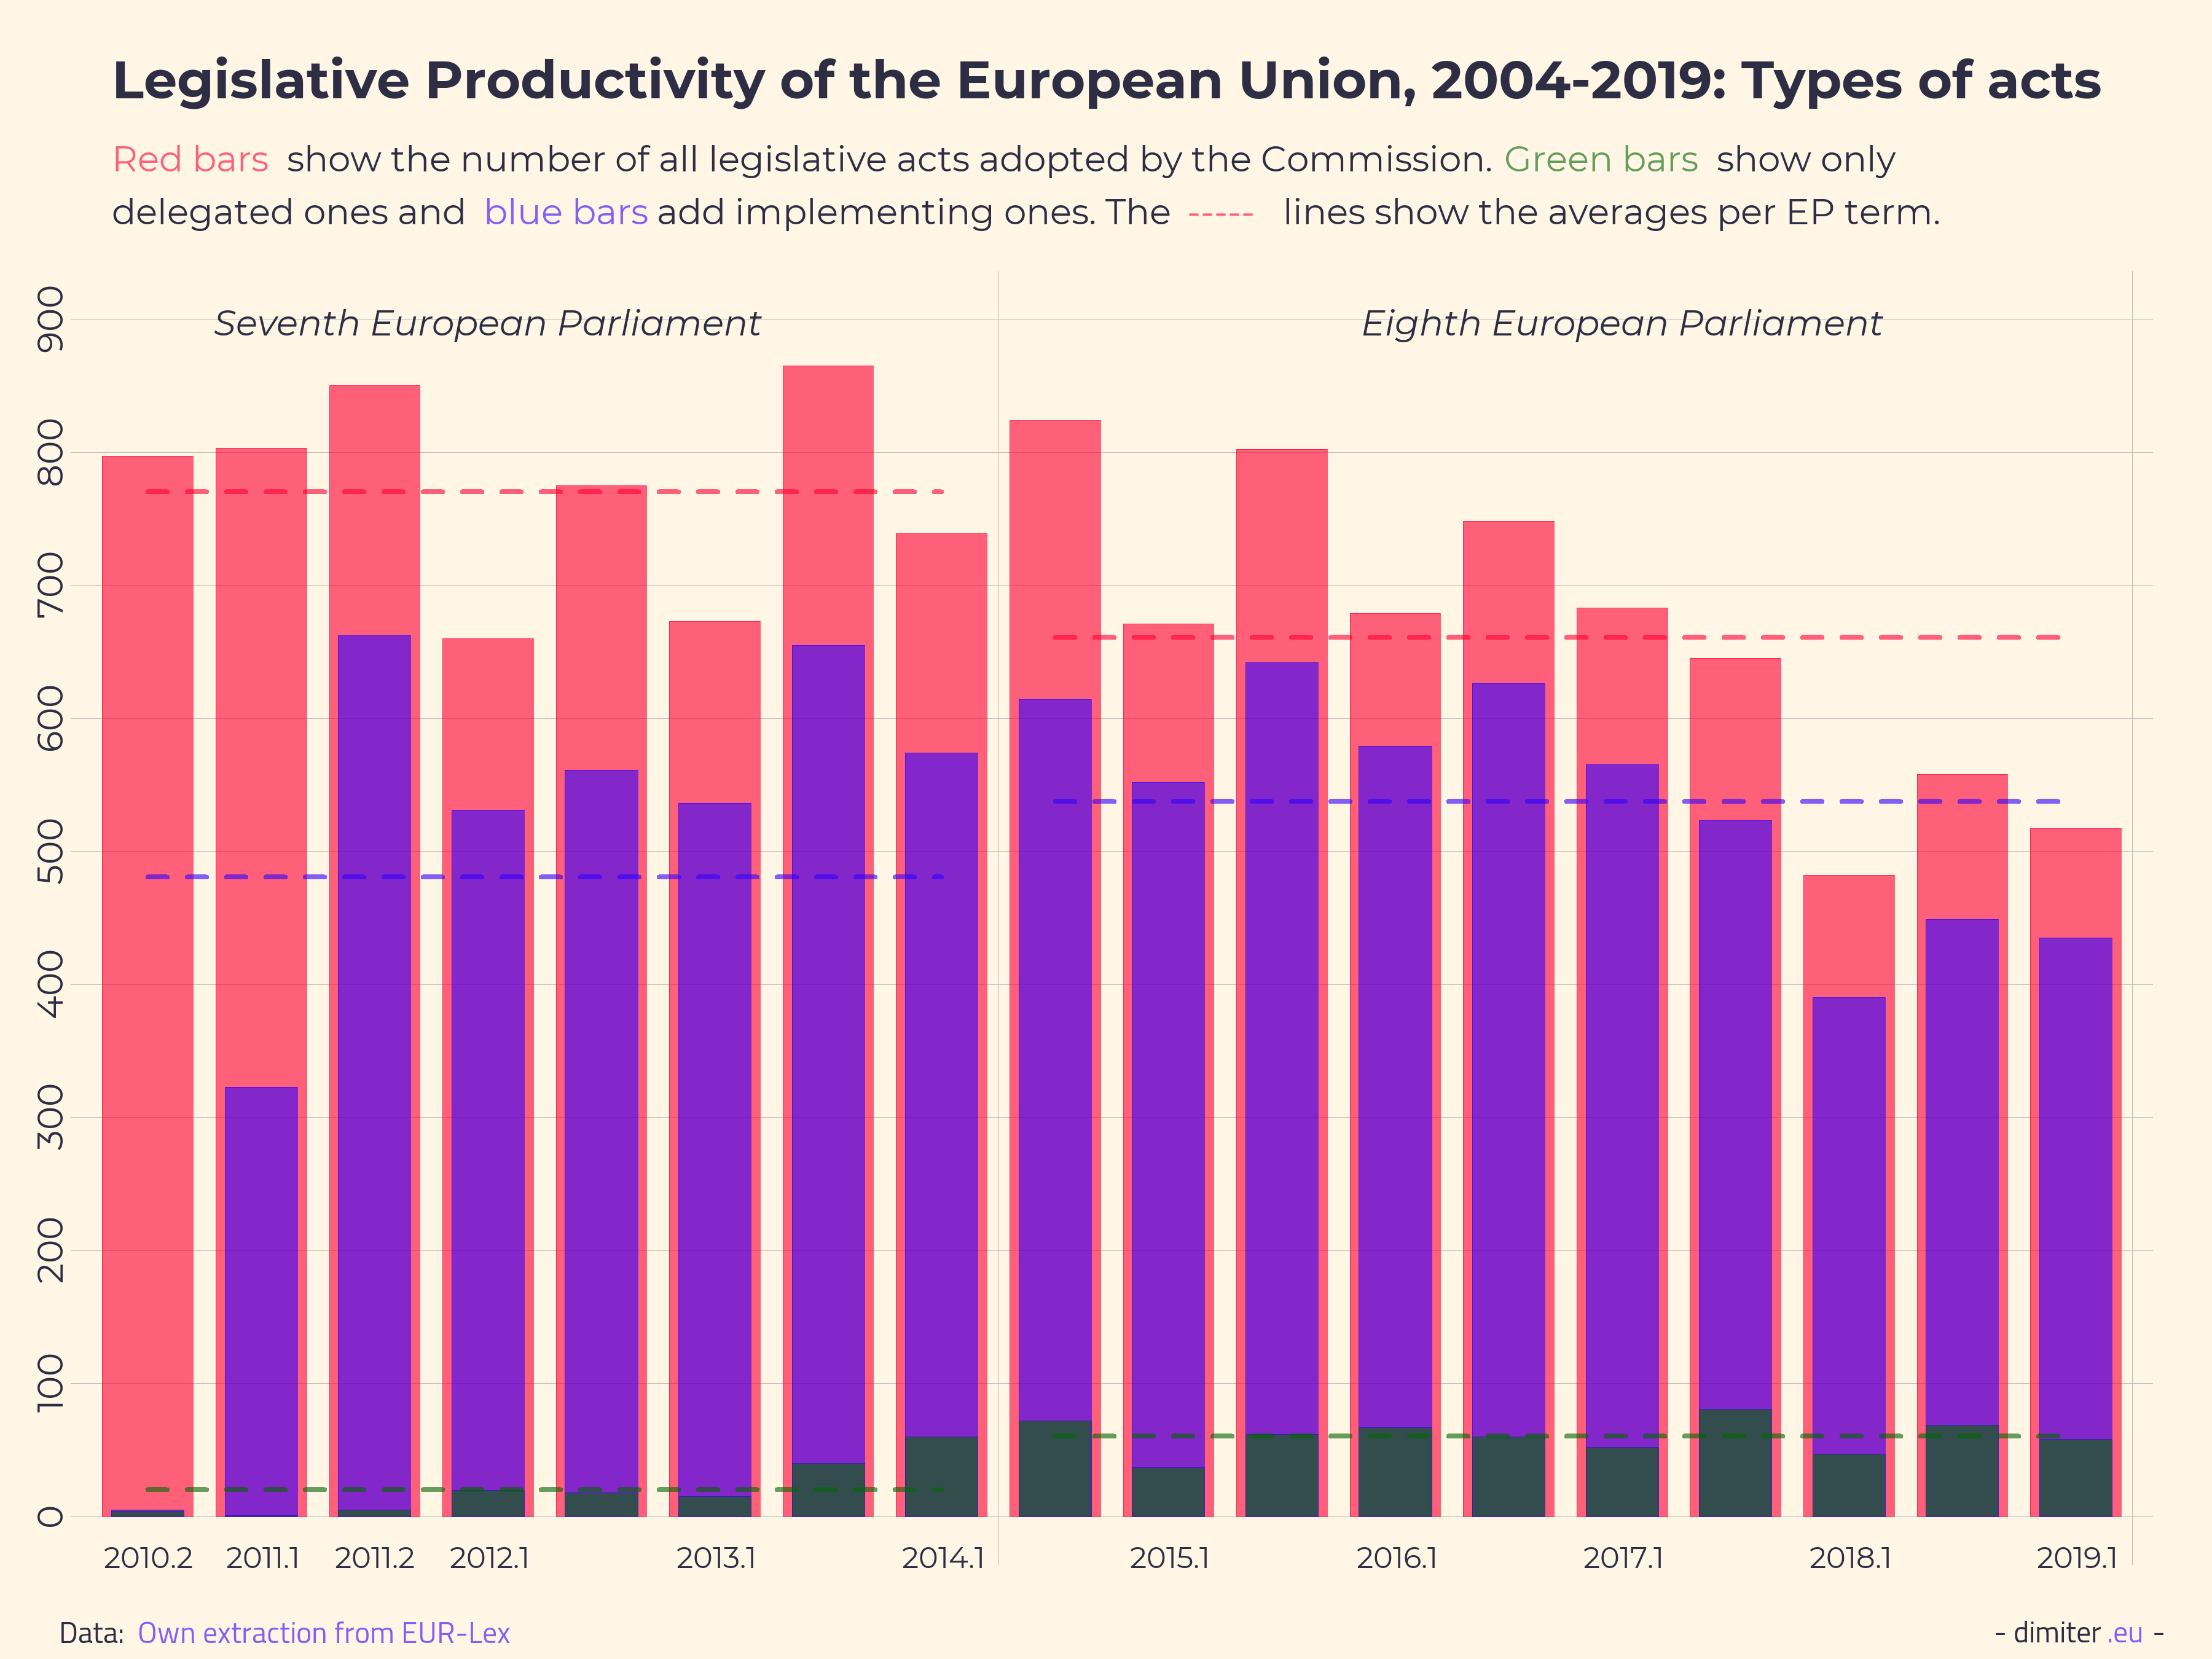
The exploration of the legislative productivity of the EU is done visually, through a series of time series plots with some short commentary. The data for the graphs is extracted from EUR-Lex, the main EU database for access to EU law. You can find the data and details about the data collection at GitHub.

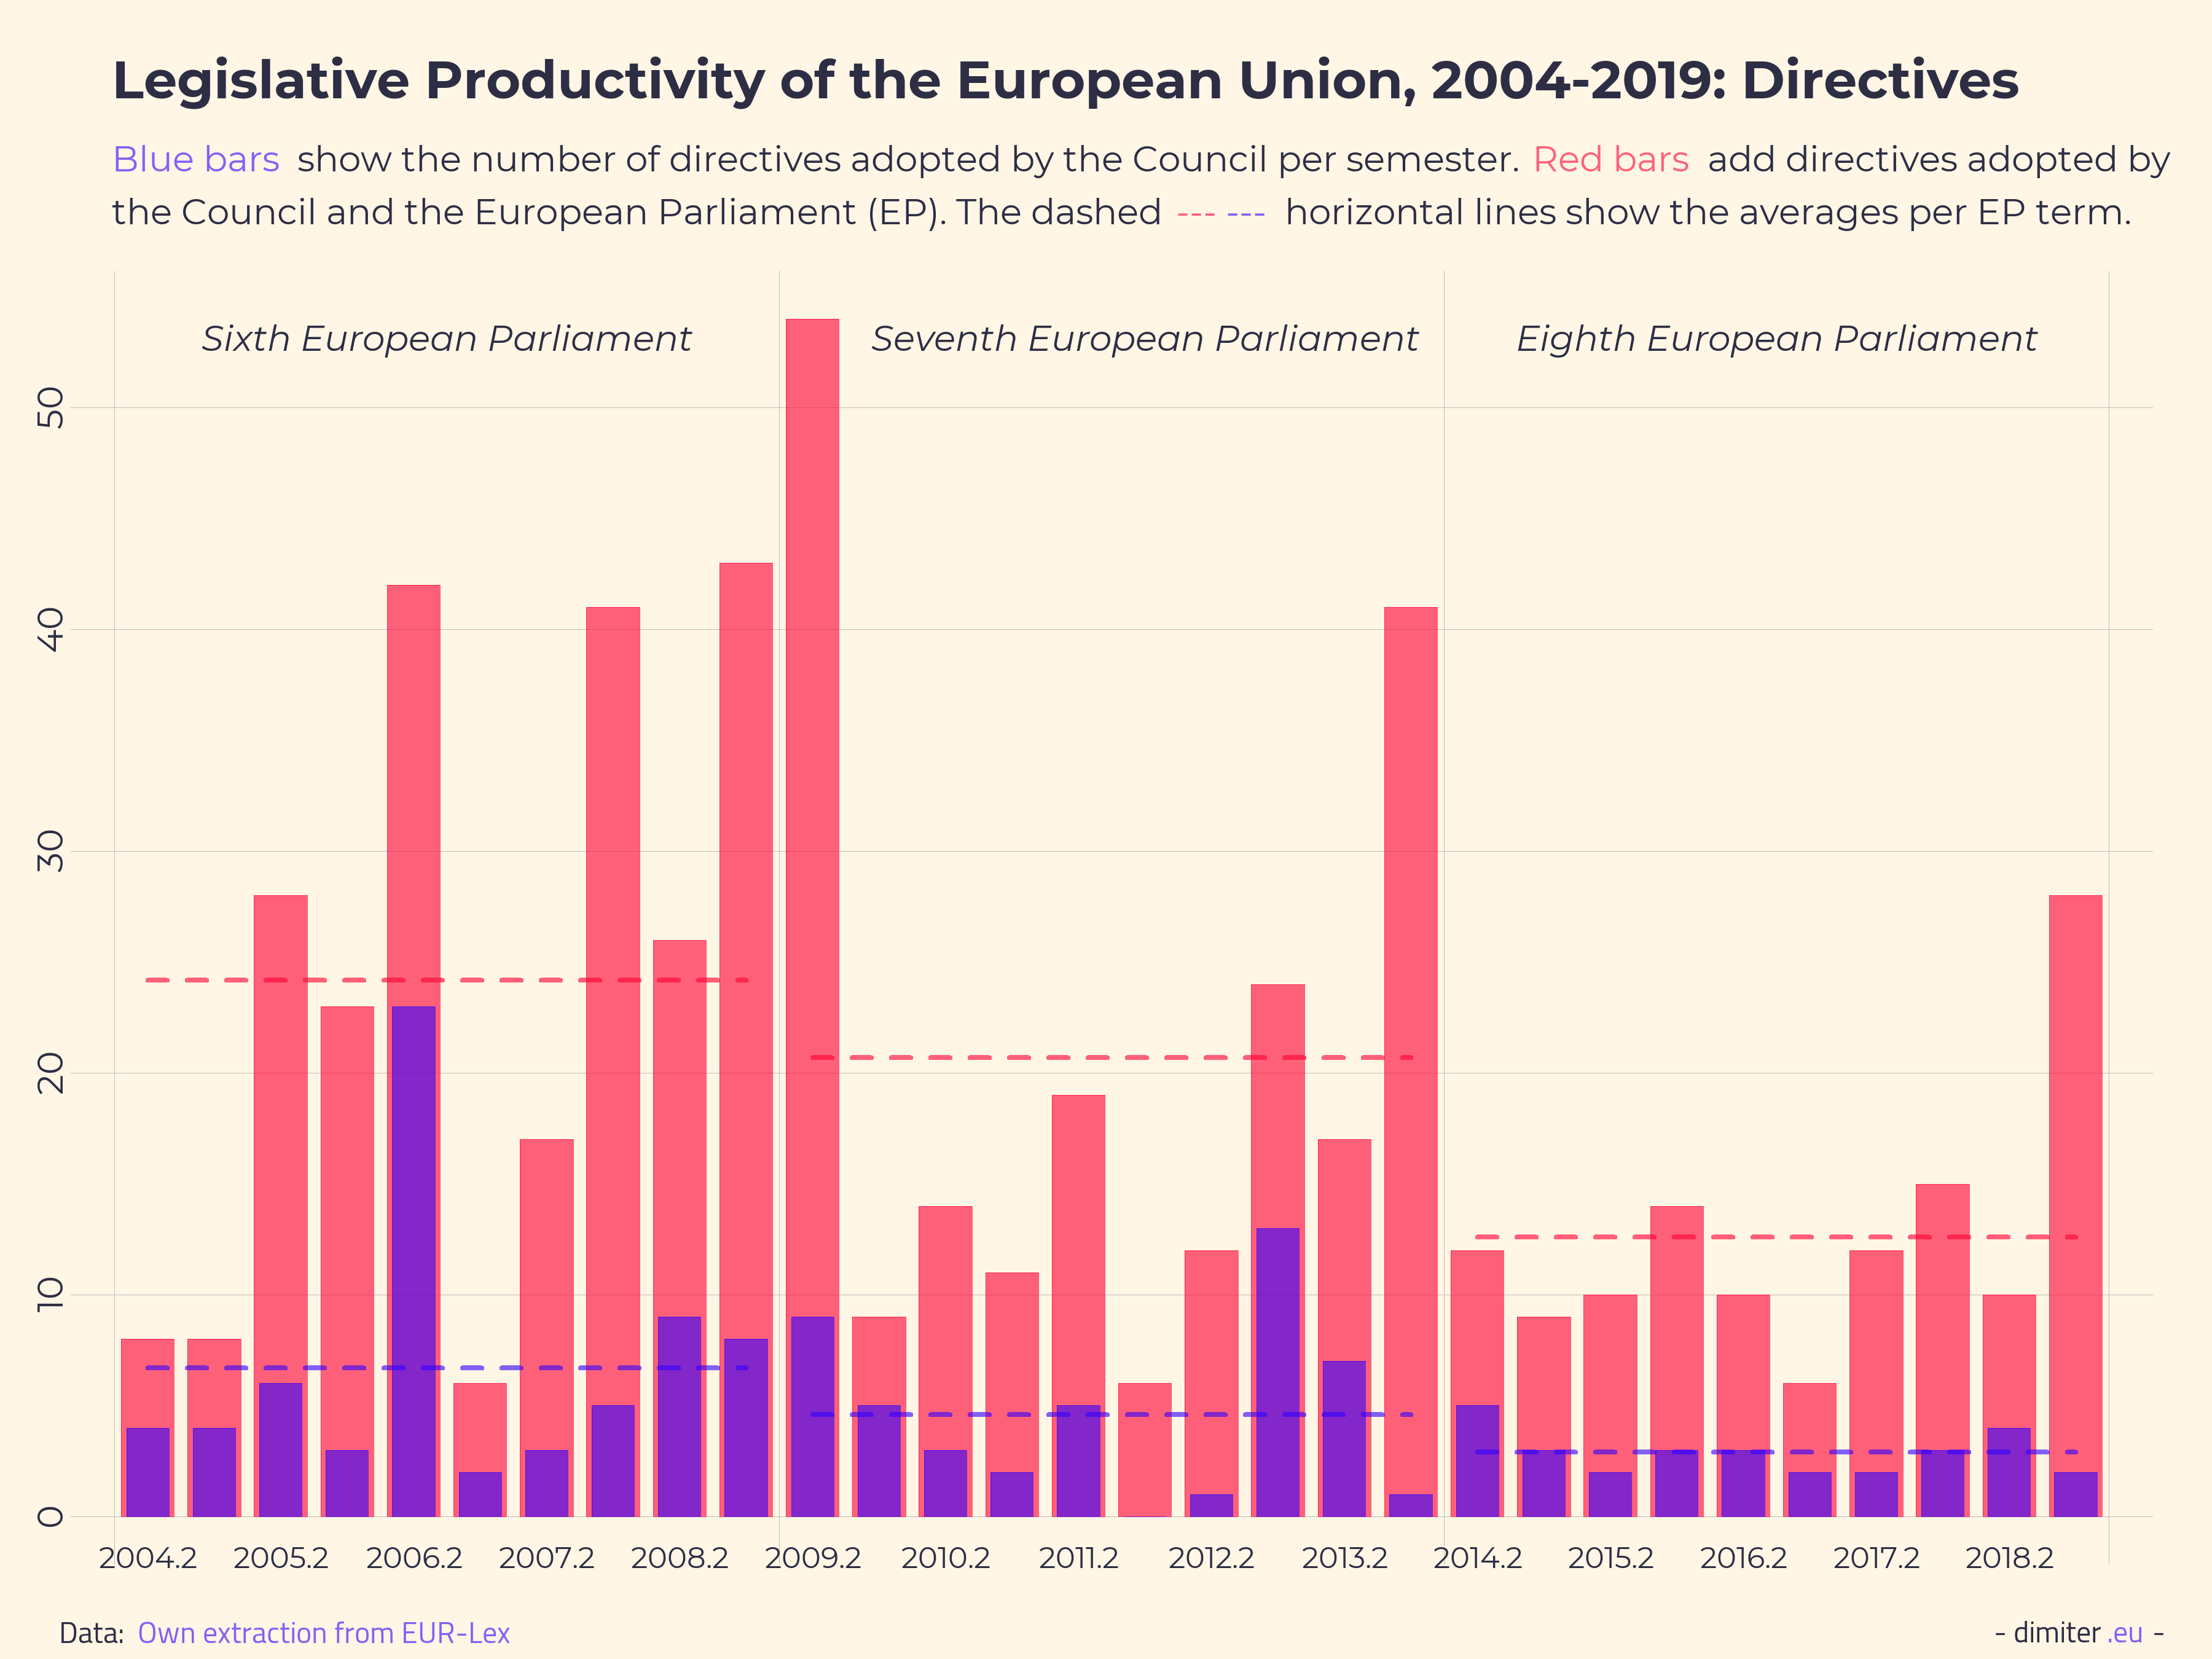
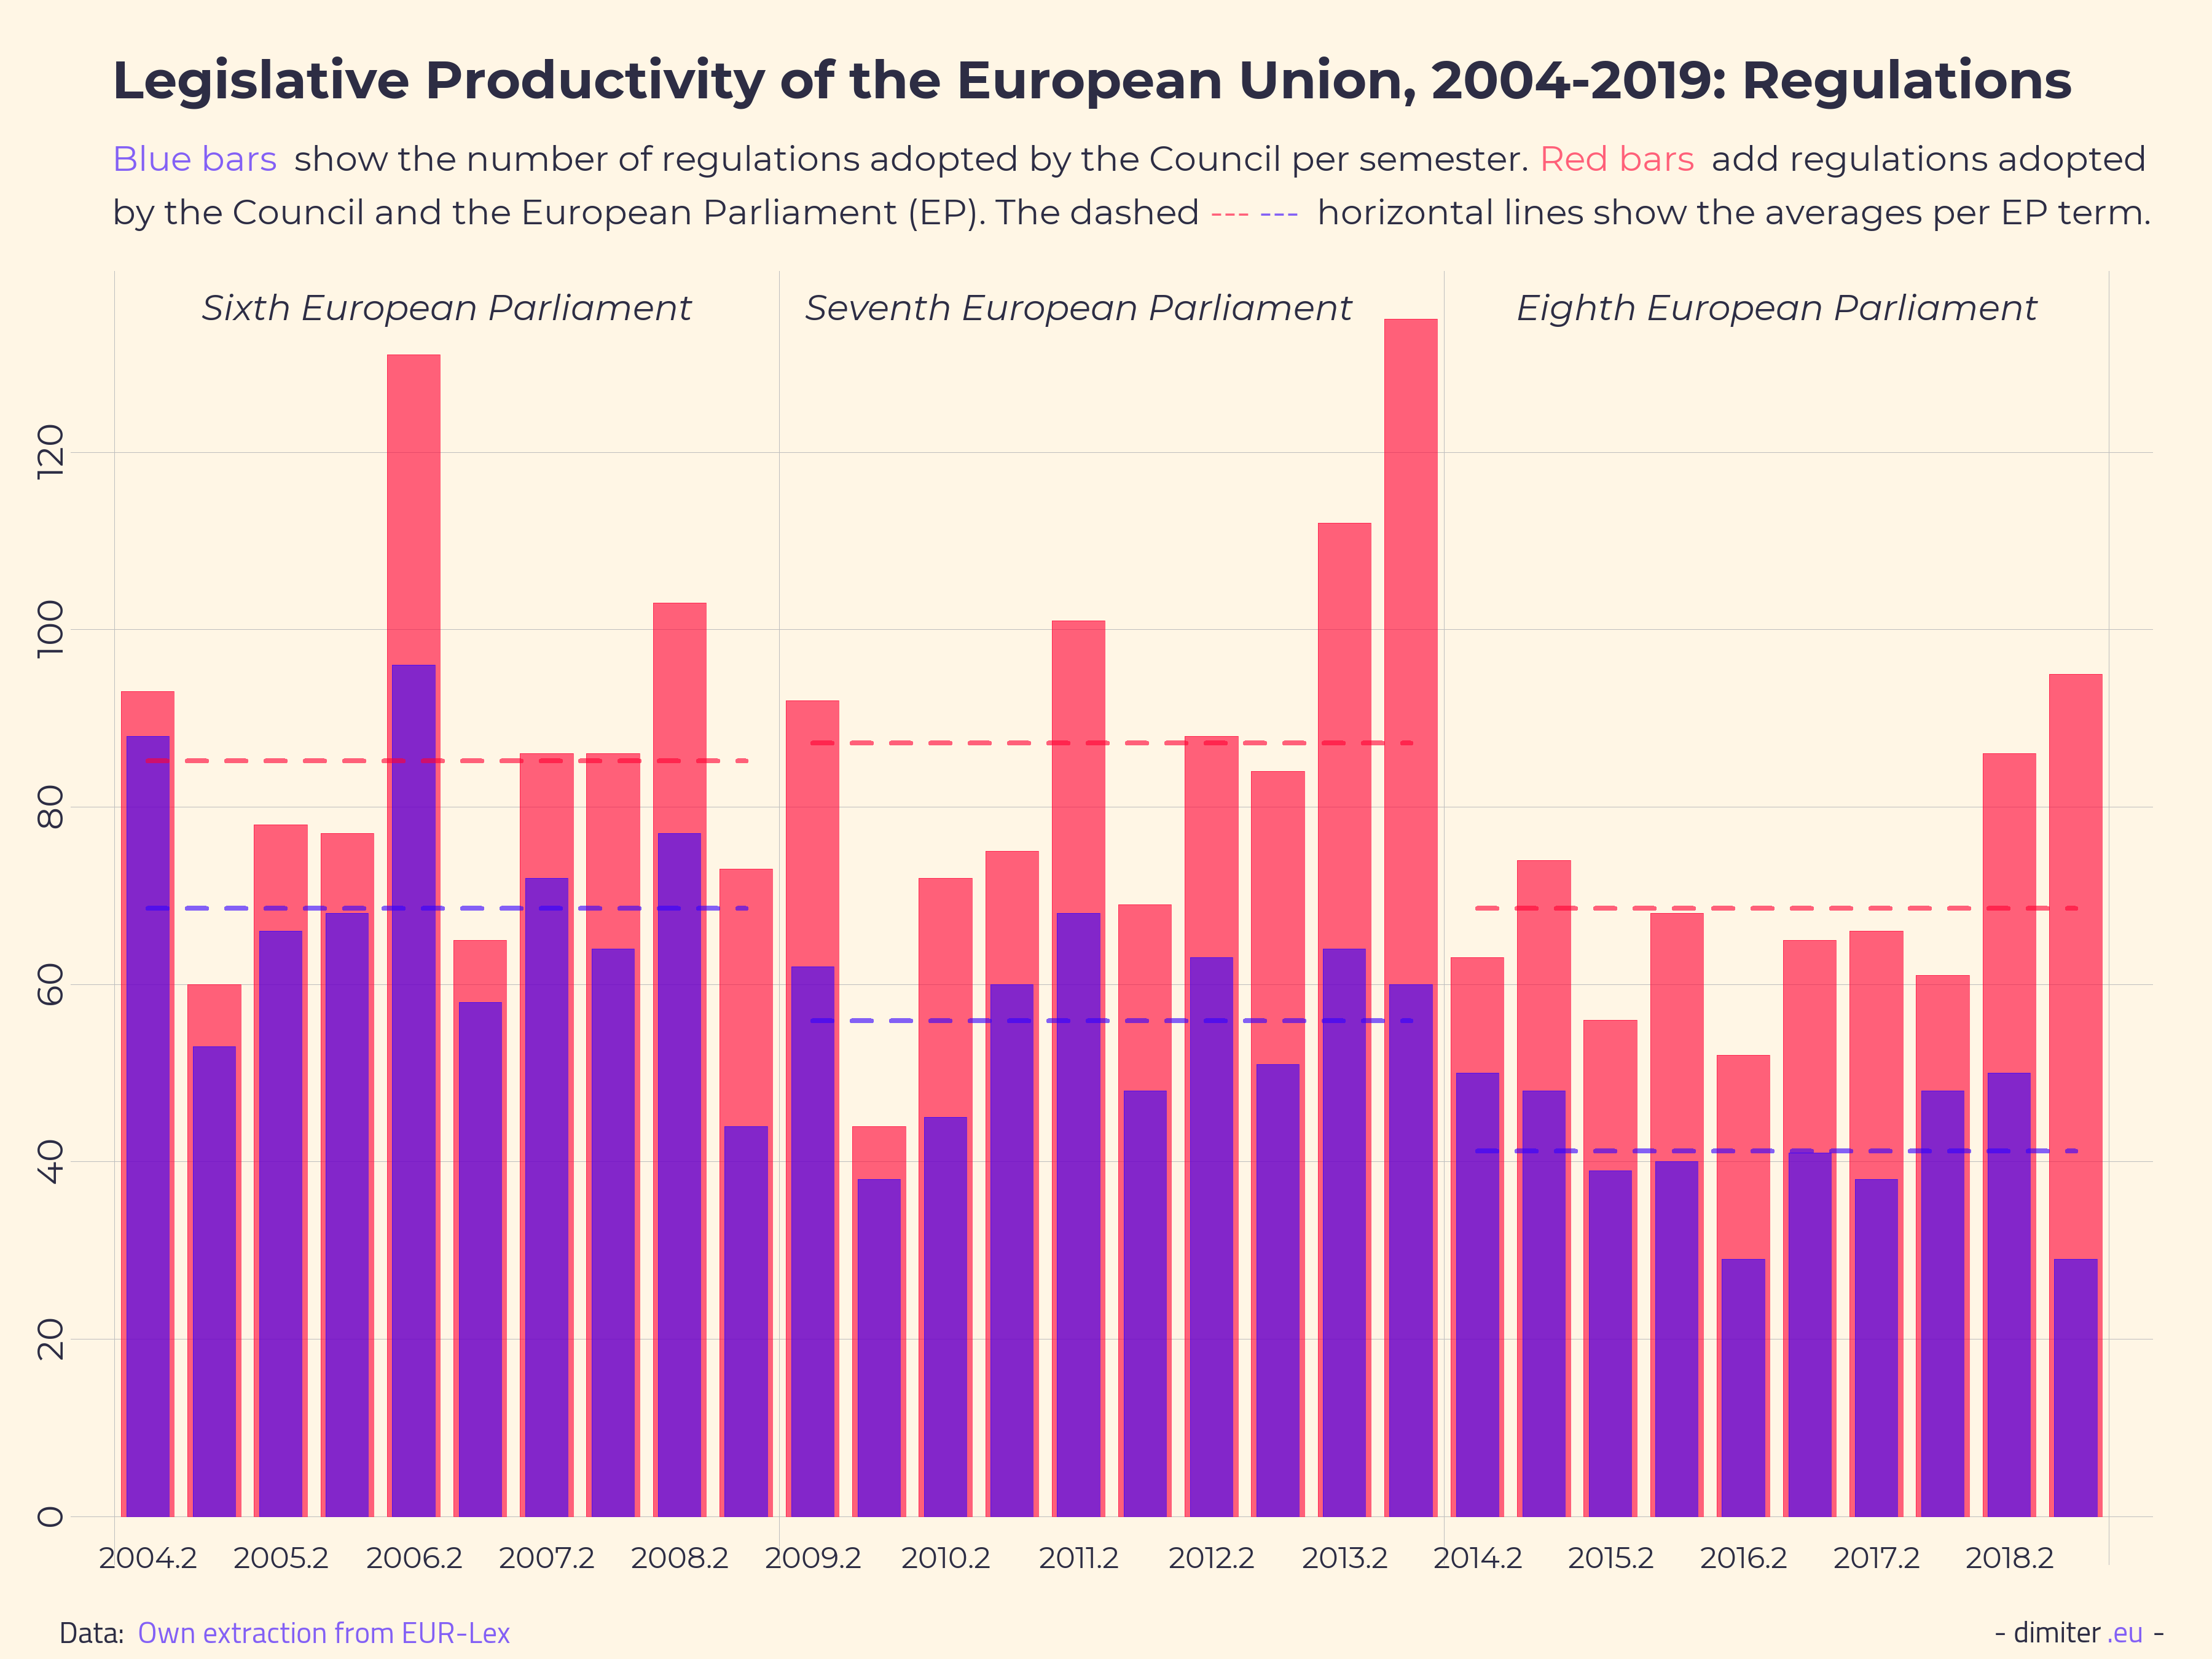
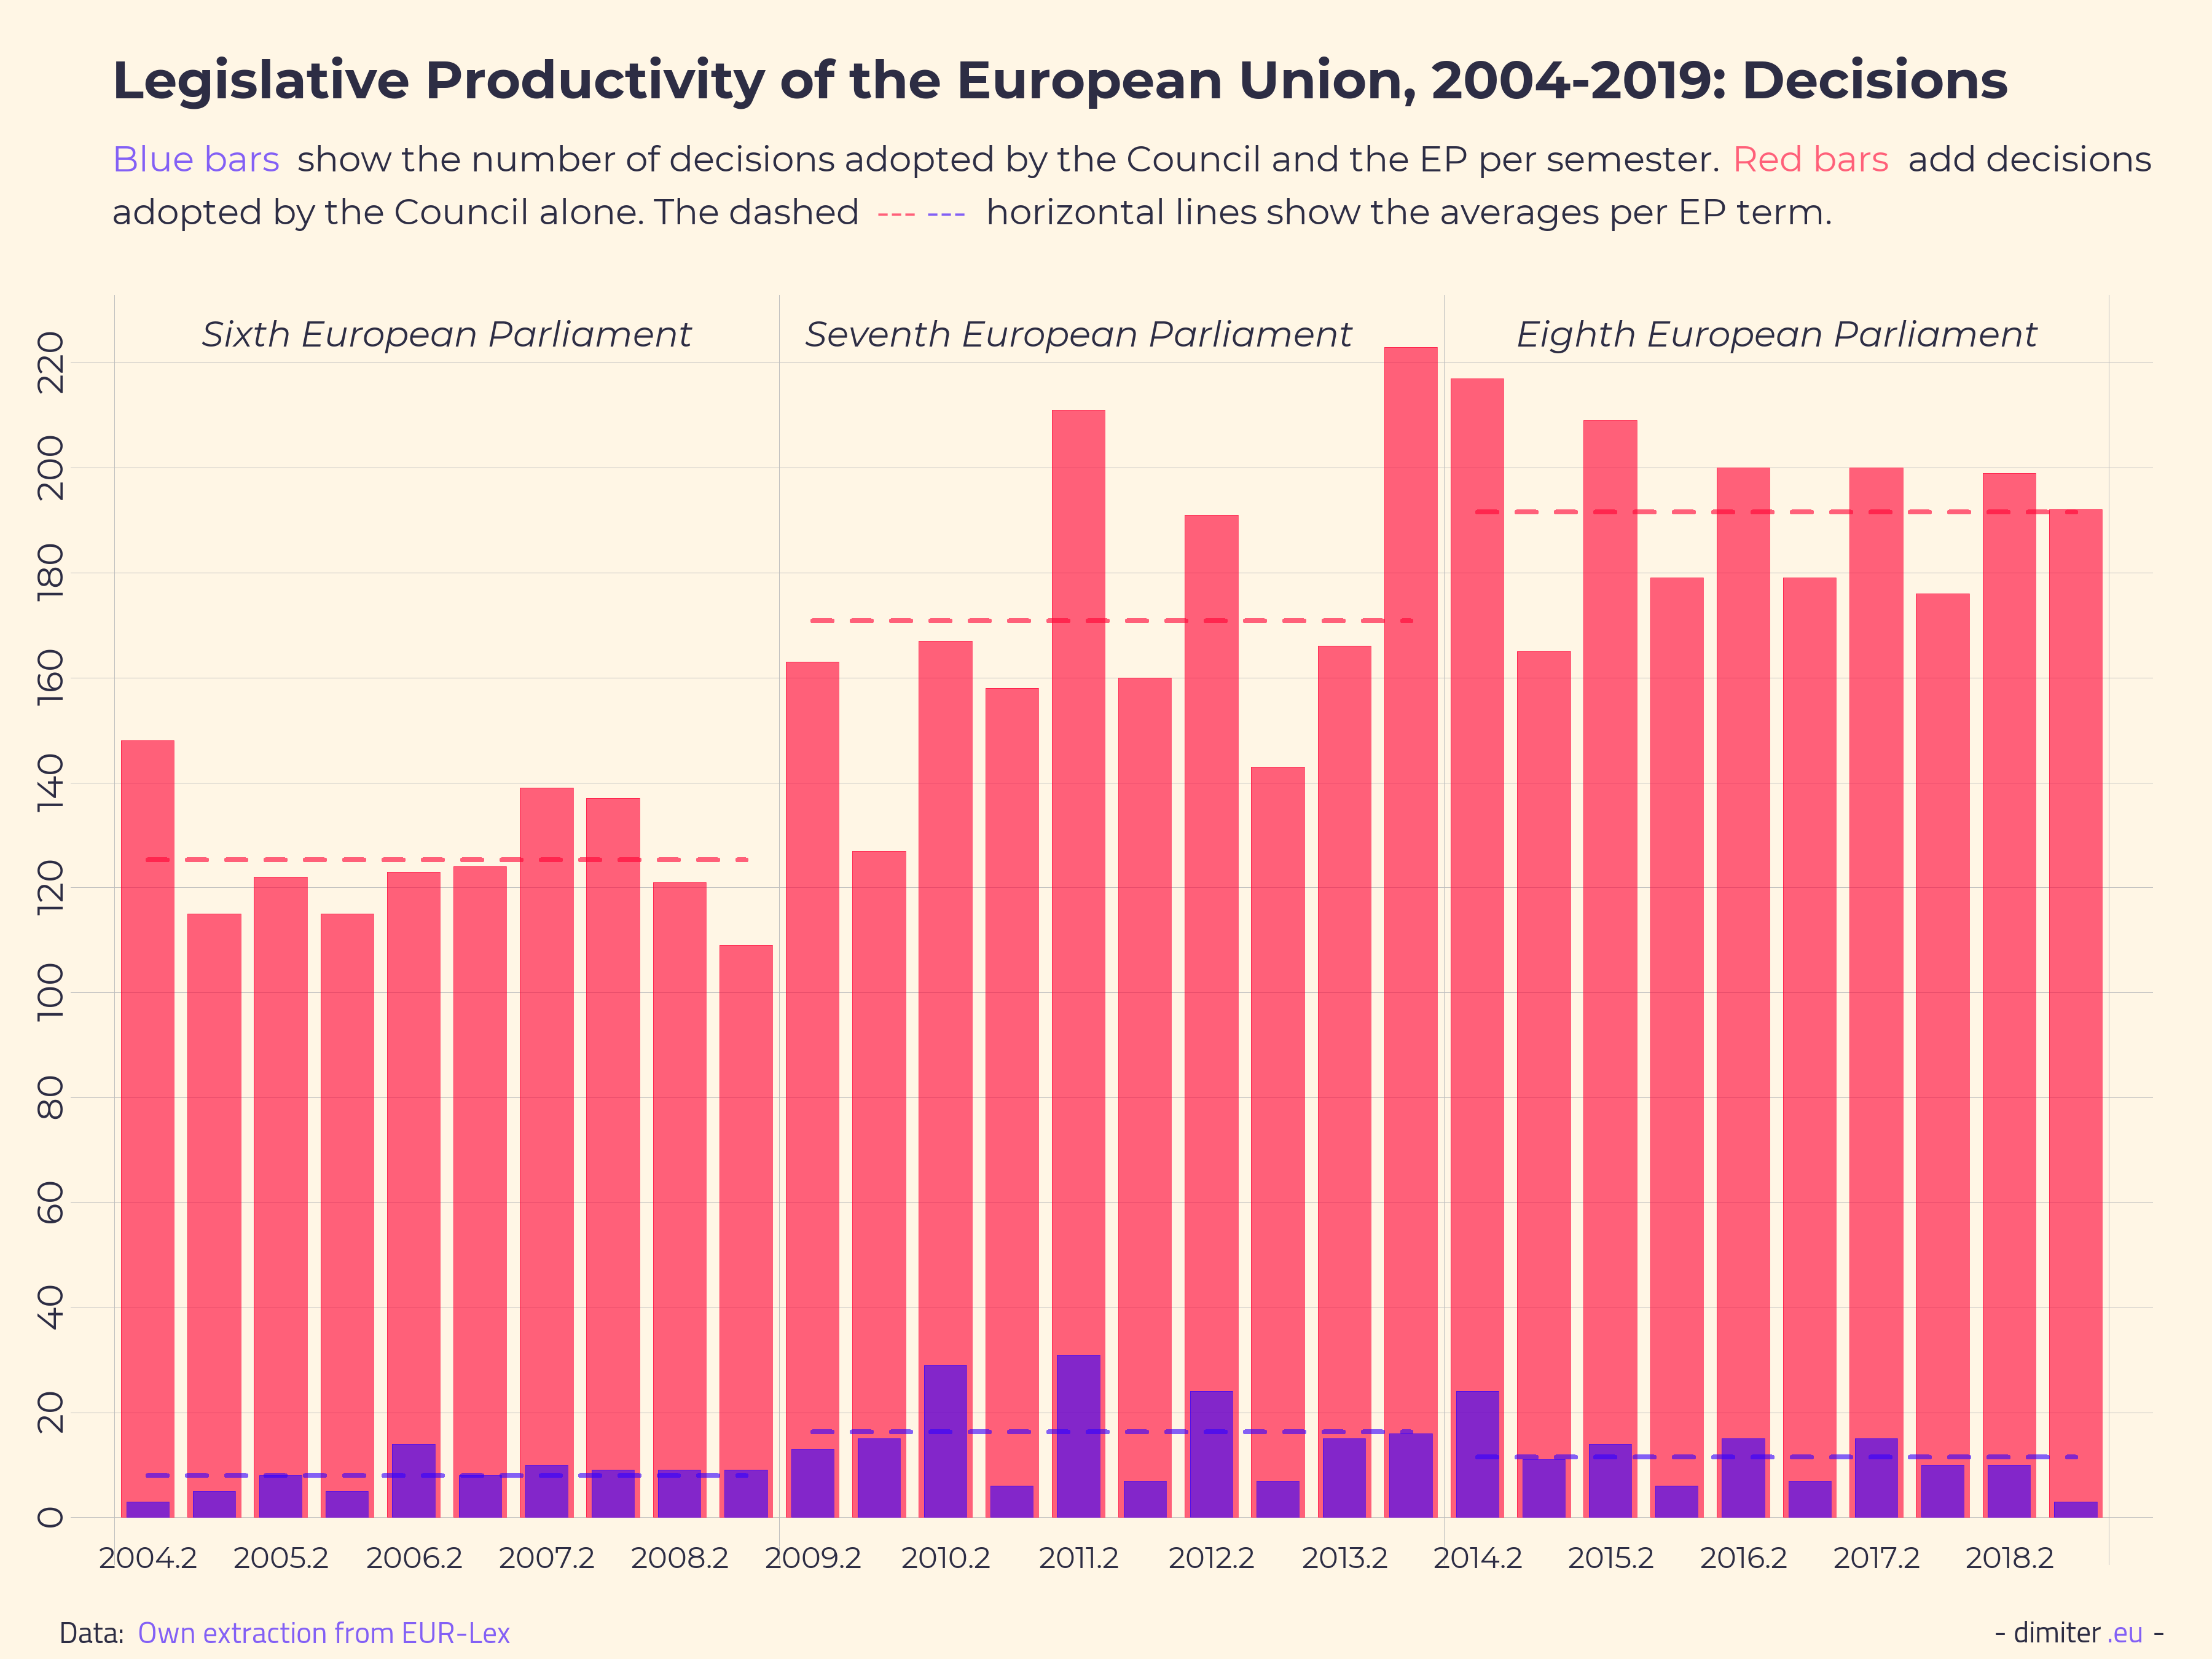
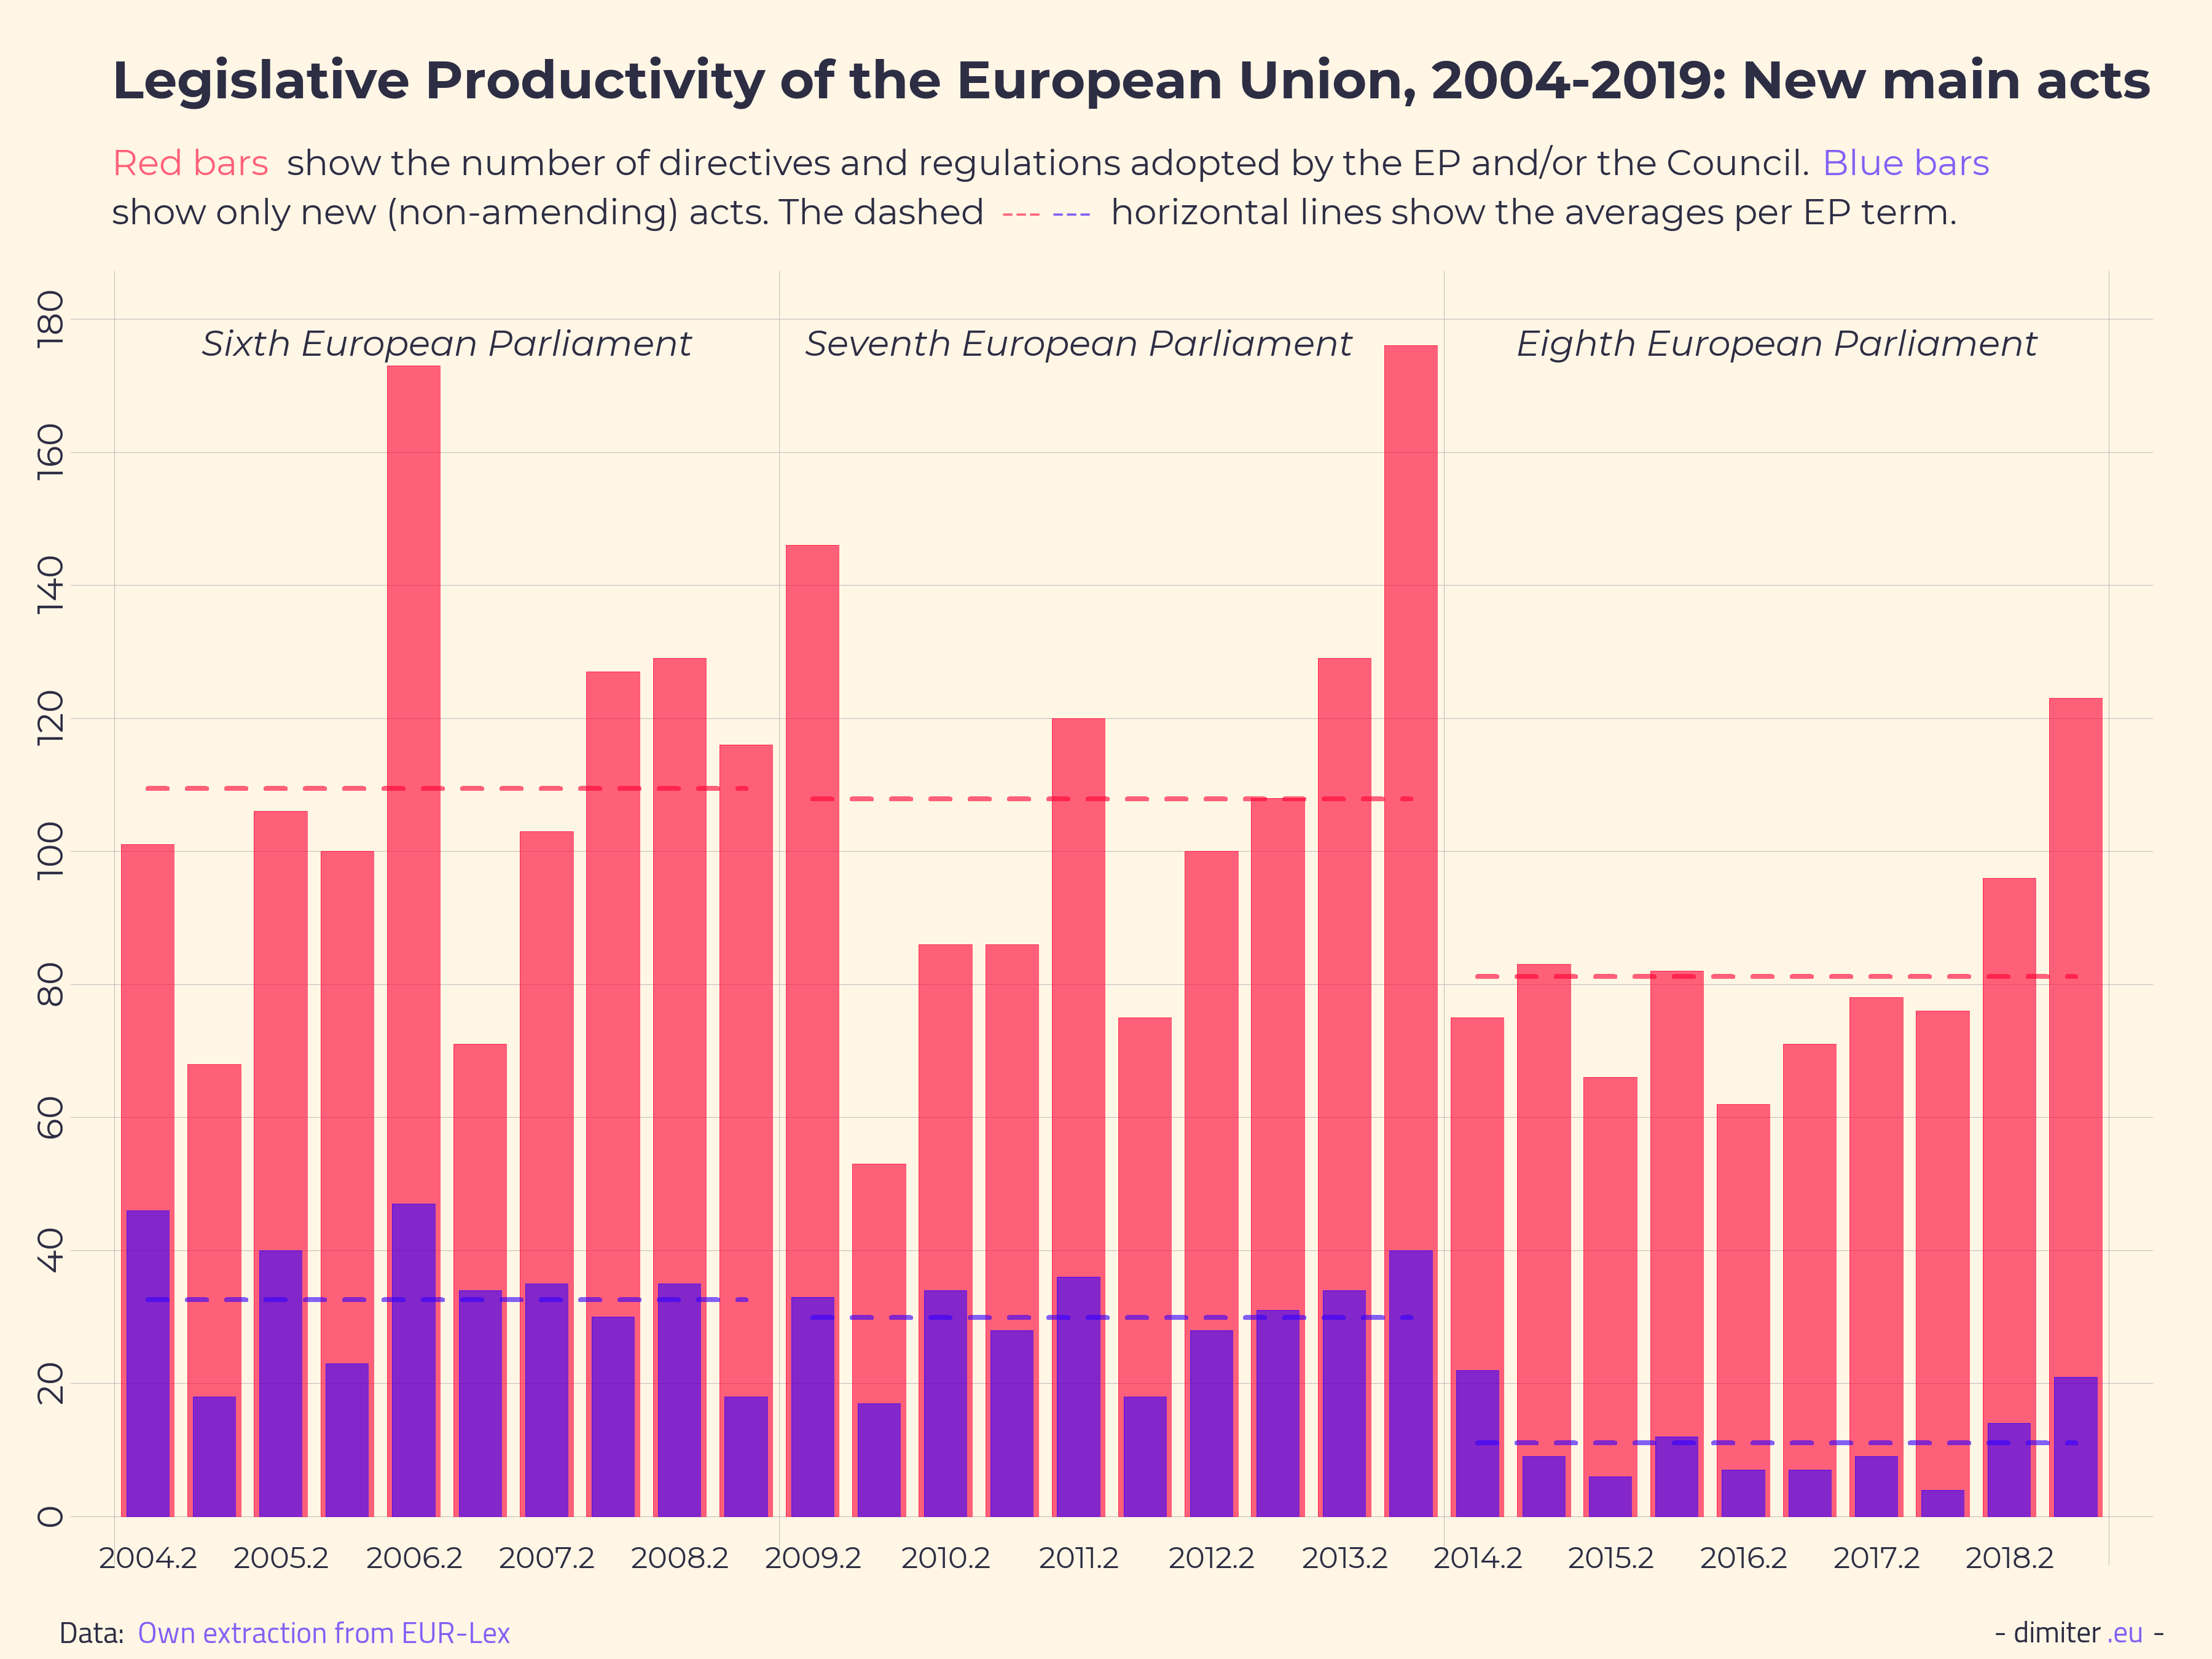
The presentation focuses on the period from 1 July 2004 to 30 June 2019 (see a presentation that covers a longer time period from 1967 till 2012 here). This includes three terms of the European Parliament (which dictate to a significant extent the rhythm of legislative production.) The starting point is after the Eastern enlargement of the EU, and the period covers the entry into force of the Treaty of Lisbon, which changed significantly the rules for making laws in the EU. The presentation focuses on the three main types of legislative acts in the EU - directives, regulations and decisions - adopted by one of the three major institutions - the Council of the EU, the European Parliament (co-legislating with the Council under the ordinary legislative procedure) and the European Commission. The data is plotted per semester rather than per year, because the European Council, which resolves many legislative negotiations, meets twice a year, and because the terms of the EP end in the middle of the year.

Ready? Let's go!


Let's start with the most important type of EU legislative act - the directive. Directives can be adopted by the Council alone or, more commonly these days, by the Council and the EP under the so-called ordinary legislative procedure (former 'co-decision'). The Commission also can adopt directives, but these are different (see below). In the past, directives embodied most of the truly important legislative activities of the EU. Most of the EU laws that you might have heard about - the Services directive, the Non-discrimination directive, the Habitats and NATURA 2000 directives - are, well, directives in the specific sense of a type of EU legal act. Therefore, the trends that Figure 1 below shows are quite significant.


As we cam clearly see, in the past five years during the term of the Eight EP there has been a significant decline in the number of directives adopted by the EP and/or the Council. (In this graph and the ones that follow, the numbers of the latest included semester - 2019.1 - might slightly increase if legal acts have been adopted but not included in EUR-Lex yet as of the time of data collection, but, even if they occur, such changes will be relatively small and will not alter the substantive conclusions of the presentation.) The decline started already in 2009, but it is especially pronounced during the latest EP term (2014-2019). The total number of directives adopted by the EP and the Council during the Sixth EP term was 175, which drops to 161 during he Seventh EP term, and to 97 for the Eighth EP term. Distributed over the five years of an EP term, this makes for fewer than 20 directives per year since 2014. So all the 751 members of the EP together with the representatives of the 28 member states and the civil servants in the European Commission have managed to complete fewer than 2 directives per month. Here is another perspective: the aggregate numbers imply that, on average, more than 7 members of the EP have worked for five years on the completion of one directive! This is not very productive, in my opinion. (Of course, some members of the EP have worked on more than one, and others have worked on none; plus, many have worked on draft legislation that did not pass eventually. But the broader point remains.)

The number of directives adopted by the Council alone also drops - from 67 in the period 2004-2009 to 46 in the next term and to 29 in the latest one - but this development is more expected in light of the limited scope for Council-only legislation introduced with the Treaty of Lisbon, effective from December 2009.

In sum, it looks like the directive - the staple of EU law - is almost disappearing from the legislative output of the EU. But the pattern of decreasing legislative output and productivity goes beyond the directive, as a specific type of legal act, as we shall see in the next graphs.


Figure 2 below shows the trends in the adoption of regulations - another important type of EU law. Again, what we see a pattern of decline. The total number of regulations adopted by the Council and/or the in the period 2004-2009 is 852, which falls to 686 in the period 2014-2019. The decrease is due to the decrease in the number of regulations adopted by the Council alone: the number of regulations adopted with the involvement of the EP is actually on the rise - from 166 during the EP's Sixth term to 274 during the Eight term. Nevertheless, overall, the EU adopts fewer regulations than 15 years ago.

These trends are important because the significant decline in the adoption of directives could partially be explained by the EU switching to regulations to embody its major legislative initiatives. (Regulations are more straightforward to implement and, unlike directives, do not require 'transposition' into national law, which often leads to delays and incorrect interpretations.) In fact, there is some evidence for that: the one piece of EU law passed over the past five years that you might have heard about - the General Data Protection Regulation (GDPR) - is, you guessed it, a regulation rather than a directive. So it is remarkable that regulations, overall, are also on the decline, while those adopted by the EP and the Council are on the rise.


The third, and final, type of legal act we're going to look at is decisions. Decisions, however, comprise a very diverse set of legal instruments under the same label - some have general applicability and some have a specific addressee, many are limited in their duration, and a large part concern matters of rather narrow interest, such as the appointment of heads of EU agencies and the like. Moreover, the data on decisions extracted from EUR-Lex does not seem to be as reliable as the one on directives and regulations, due to their varied character. Still, looking at the trends in the number of decisions adopted by the EP and/or the Council can be instructive. Figure 3 below shows the trends:


What we can see are two diverging developments: while the number of Council-only decisions increases significantly (from 1173 to 1546 to 1801 over the past three EP terms), the number of decisions adopted with the involvement of the EP decreases (from 163 in the period 2009-2014 to 115 in the period 2014-2019). Arguably, this implies that while there is an increase in the number of legal acts needed to keep the EU bureaucratic machine running, there is a significant decline in the rate of expansion of EU legislative reach (for more on that last point, see below).

At this point, we can update our assessment of the EP's productivity by adding all types of legal acts adopted with its involvement together. The latest EP has been involved in the completion of 486 legal acts, a significant decline from the 637 completed by the Seventh EP. This number makes for less than one legal act per MP over a period of five years: still not very productive! One can argue that passing legislation is not all that the EP does, and that would be correct: the EP also adopts declarations, negotiates the budget, etc. Still, legislating remains the most important task of a legislature, and the last EP has not done a lot of that.


If the EU's legislative productivity already appears as, well, not very strong and certainly not growing from the graphs above, looking at the number of new legislative acts, in particular, only reinforces these impressions. The figure below plots separately the number of new legal acts (directives and regulations) - that is, legal acts that do not amend, recast, repeal or otherwise change already existing legislation. As such, new acts are most relevant for our assessment of whether the EU is moving into new areas of competence and whether it is expanding its regulatory and legislative reach.


The trends in the graph above and the corresponding numbers are quite clear. For the period 2014-2019 the EP and/or the Council have adopted a total of 111 new directives and regulations. (The corresponding number for the period 2004-2009 is 326). In fact, only 19 new directives have been adopted with the EP's involvement over the past five years.


The last part of the presentation looks at legislation adopted by the European Commission. This is legislation that implements and fills-in the details of legislation already passed by the EP and/or the Council. As such, it is more indicative of the legislative effort that goes into keeping the regulatory state running and updated rather than of legislative expansion. The figure below shows the main trends:


Clearly, there is a general decline in the number of acts adopted by the Commission, and the decline is consistent across all three main types of legal acts.

Finally, we can look at the composition of the new types of Commission legislation as introduced in the Treaty of Lisbon: delegated and implementing legislation. (Yes, all Commission legislation is in a sense delegated and implementing, but these acts are explicitly so. Don't ask me to explain why this terminological mess was created.)


As we can see, implementing acts have been most popular, although delegated acts have a notable presence as well. Still, there remains a significant share of Commission legal acts that do not fall in either of these two categories.

In conclusion, the legislative ouput of the EU is not increasing over the past five years; if anything, it is on the decline, and the absolute level is quite low, especially when it comes to new and significant legislation. The number of directives in particular is really low, to the extent that the directive might be disappearing as a major legal instrument in the EU. What are the reasons behind all these trends? Good question, but one for a separate post!


About

This presentation has been put together by Dimiter Toshkov and last updated in July 2019. The presentation is based on data extracted from Eurlex. For details on the data and code for the extraction, aggregation and visualization, see the GitHub page of the project. If you end up using the presentation or the data, please provide the following reference:
Toshkov, D. (2019) 'Legislative Productivity of the EU, 2004-2019', Online presentation, Available at: http://www.dimiter.eu/Visualizations_files/Eurlex2019.html