
The world is football for another week! On this wonderful occasion, enjoy a set of visualizations of the results of the FIFA World Cup since 1974, with a focus on the four semi-finalists - Argentina, Brazil, Germany, and The Netherlands.
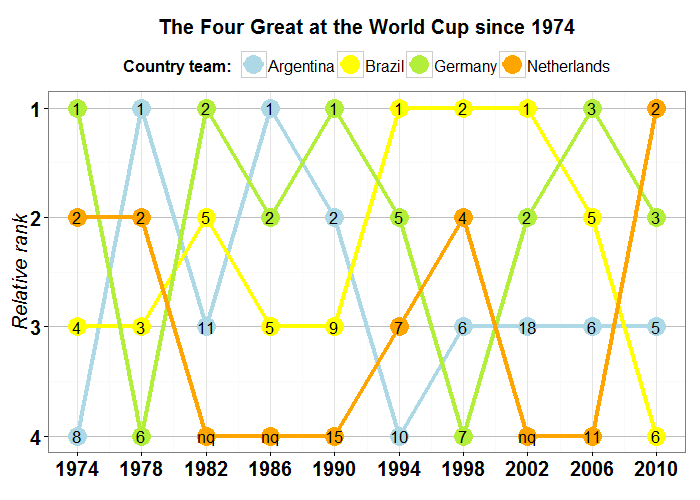
First, let's focus on the four 2014 semi-finalists - Argentina, Brazil, Germany, and The Netherlands. These four teams are all too often near the top, but just how often? This graph shows the realtive position of the four teams at each World Cup since 1974. The numbers in the circles indicate the absolute positions.

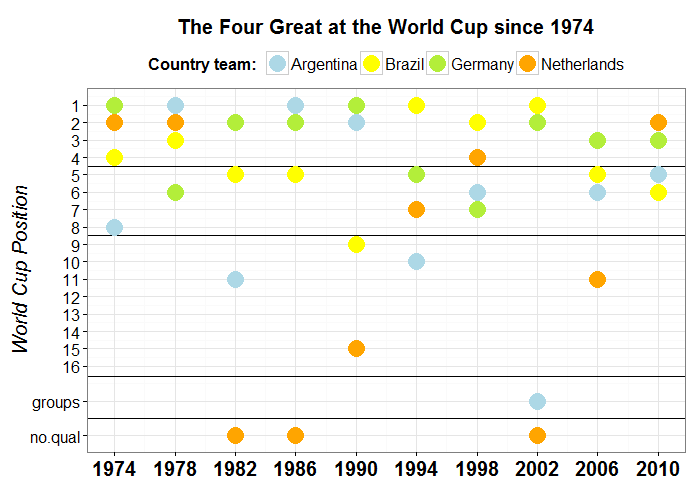
Another way of looking at the same data, now with absolute rather then relative positions.


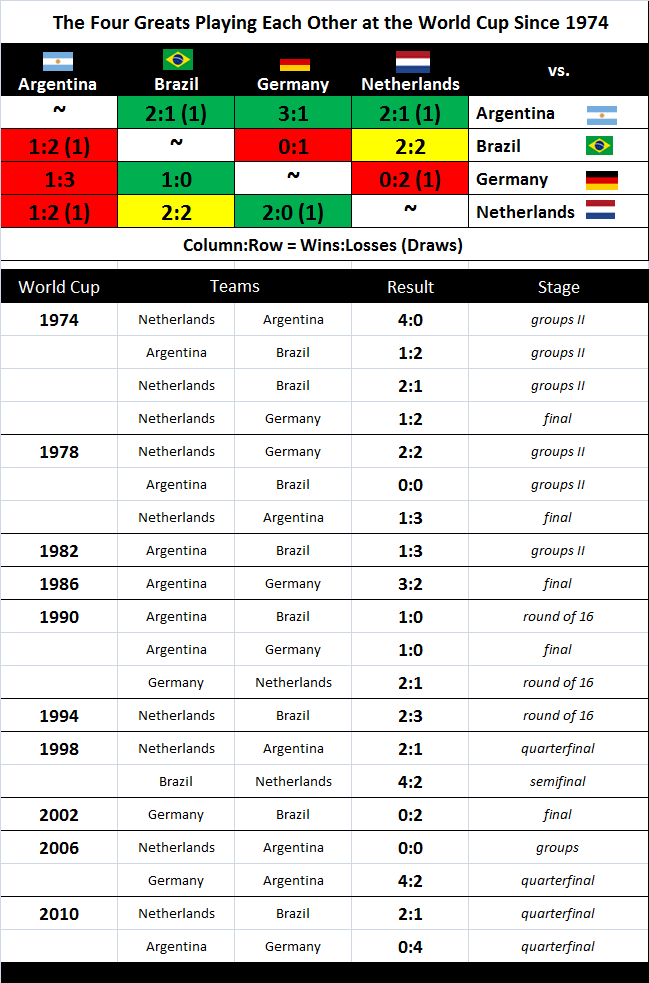
These four countries have a long history of football rivalry. This table summarizes the results and lists the World Cup matches between the four teams since 1974.

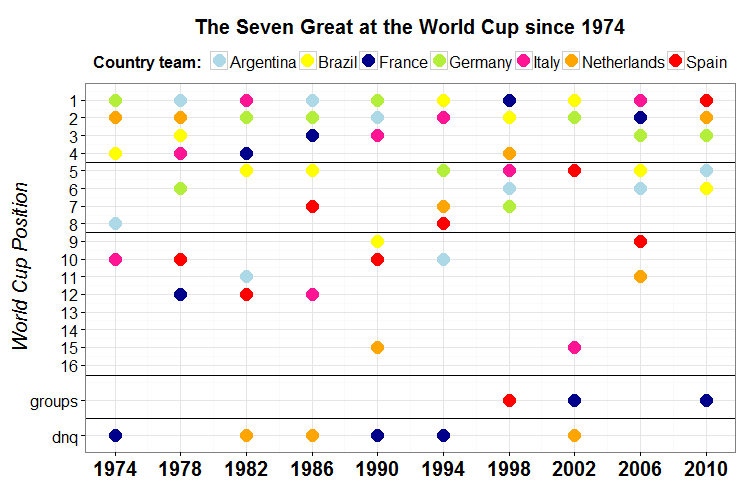
Finally, let's add Italy, Spain, and France to the mix. These seven coutnries acount for all throphies, silver medals, and most of the other top places as well.

This visualization has been put together by Dimiter Toshkov and last updated in July 2014.
The visualization is based on data from Wikipedia, graphed with the ggplot2 library in R.
